
author
William McKee

As a manufacturer, you know the importance of constantly measuring and improving your operations to stay competitive. However, many industrial companies neglect to apply these same principles to their marketing efforts. Why? Because it's hard to know where to start.
Where do you stand against your competitors? Are you reaching your target audience effectively and is your website optimized for search engines? These are all questions that can be answered through an industrial SEO benchmark that tracks your visibility, traffic, and lead generation over time.
Why an Industrial SEO Benchmark Matters
The stakes are high for industrial companies. You're competing in a specialized and often niche market, with long sales cycles and high-value products. Visibility matters, and every lead counts, so your marketing efforts must be targeted and strategic.
Benchmarking your SEO performance gives you valuable insights into how much traffic you're receiving, how well you're engaging your visitors, and how many leads are being generated. This information can help you identify areas for improvement and make data-driven decisions to optimize your industrial SEO strategy.
Understanding KPIs
Before you can benchmark your industrial SEO performance, you need to know what metrics are most important to track — your KPIs (Key Performance Indicators). They will vary depending on your specific goals and target audience, but here are some general KPIs that apply to most industrial companies:
- Impressions: How often your website appears in search results.
- Clicks: The number of clicks your website receives from search engine results pages (SERPs).
- Click-Through Rate (CTR): The percentage of users who see your listing and click through to your website.
- Sessions: The total number of times users visit your website (often referred to as website traffic).
- Engaged Sessions: Sessions where users take a desired action, like downloading a white paper or contacting your sales team.
- Engagement Rate: The percentage of sessions in which users engaged with your site, such as clicking on a link, watching a video or scrolling through content.
- New Users: The number of users visiting your website for the first time.
- Conversions: The number of users who complete a desired action, such as filling out a contact form or making a purchase.
- Conversion Rate: The percentage of users who complete a desired action on your website, such as making a phone call or filling out a contact form.
You can use free and paid analytics tools like Google Search Console, Google Analytics, and HubSpot to track these KPIs and gain valuable insights into your website's performance.
Why Generic Benchmarks Don't Cut It
The problem with generic benchmarks is that they involve comparing your company's performance against industry standards or best practices that may not be relevant to your specific situation.
Generic benchmarks can be misleading, leaving you feeling frustrated and uncertain about your true performance. Why? Because factors like company size, industry niche, and target audience all significantly impact your website's traffic and engagement. Comparing your results to a national retail chain wouldn't be very helpful, would it?
That's why industry-specific benchmarks are so important. They give you a way to understand how you measure up against similar industrial companies vying for the same audience. But how do you go about setting SEO performance benchmarks tailored specifically to your industrial company?
Finding Industry-Specific Benchmarks
Databox makes it easy to set up a free, completely anonymous benchmark group in seconds. We partnered with Databox to create an exclusive Digital Marketing Performance Benchmark Group, made specifically for industrial and manufacturing companies.
Now, it's easy to compare your website's performance against industry peers, providing a clear picture of where you stand and where there's room for growth.
Join our exclusive SEO Benchmark Group
When you join our exclusive SEO Benchmark Group, you will get a comprehensive understanding of your industrial company's digital marketing performance. Here's how to get access:
- Visit the Databox website.
- Click on "Join Group" in the top right corner.
- Fill out the necessary information to connect your data.
By connecting your data source (like Google Search Console) to our secure platform, you'll gain access to informative red and green charts that visually represent your strengths and opportunities.
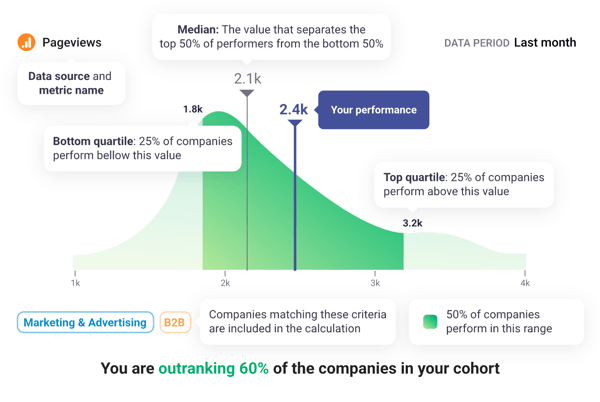
How to Read Your Benchmark Results
Once you've joined the group and connected your data, it's time to take a closer look at what your benchmark results mean. You can request a consultation to review your benchmarks together or dive into the data on your own. Either way, here are some key things to keep in mind:
- Green vs. Red: Green charts identify areas where you are outranking other companies in your cohort. Red charts highlight areas where you may need to improve. This data-driven approach removes the guesswork and helps you focus your efforts on what matters most.
- Bottom Quartile: This metric shows where your data falls compared to the bottom 25% of companies in your benchmark group. If you're seeing a lot of red here, it's time to take action and improve your performance.
- Median: This metric shows how you stack up against the middle performers in your benchmark group. Ideally, you want to be above the median in order to stand out from the competition.
- Top Quartile: This metric shows where your data falls compared to the top 25% of companies in your benchmark group. Aim to consistently perform in this range for optimal results. If you're already in the top quartile, congrats! Keep up the good work.
Using Benchmarks to Drive Improvement
Now that you have a better understanding of your industrial company's digital marketing performance compared to industry peers, it's time to use this information to drive improvement. Here are some tips for using benchmarks effectively:
- Set realistic goals: Use your benchmark results as a starting point to set realistic and achievable goals for your digital marketing efforts.
- Identify gaps: Look at the red charts in your benchmark results and use them as a roadmap for areas where you can improve your website's performance.
- Track your progress: Continuously monitor your KPIs and compare them to your benchmark results to track progress and make adjustments as needed.
- Stay ahead of the curve: Keep an eye on your benchmark results and compare them to industry-wide data to stay informed about any significant shifts or changes in the digital marketing landscape for industrial companies.
By regularly utilizing benchmarks and tracking your progress, you can improve your industrial company's digital marketing performance and stand out from the competition.
Conclusion
Don't let a lack of benchmarking hold back your industrial marketing success. When you join our exclusive SEO Benchmark Group, you'll gain valuable insights and set data-driven goals that will help you achieve significant growth.
With industry-specific KPIs and benchmarks in place, you can confidently make decisions that will propel your digital marketing efforts forward.
Join our SEO Benchmark Group or request a benchmark consultation today to see see the transformative impact it can have on your growth.


