

Marketing KPIs exist to give you benchmarks of success. You can measure the effectiveness of certain campaigns, see where your strategy is lacking and devise data-driven strategies for improvement. It puts numbers to each of your efforts so you can make informed decisions moving forward. Let’s take a closer look at marketing KPIs and how you can use them to set objectives and measure success.
What is a Marketing KPI and How Do They Help Leaders Make Informed Decisions?
Key performance indicators are a quantitative measure of your marketing campaigns. They gather data about your efforts and translate them into numbers you can use to adjust accordingly. This might sound like the most basic level of data-driven marketing, but your KPIs can tell you much more than open rates or number of downloads.
Marketing KPIs measure marketing efforts, but they go far beyond a single campaign. They inform performance benchmarking for your company, showing you if and when you’ll meet established business or marketing goals. Some marketing KPIs examples include:
- Social media reach and engagement
- Cost of conversion per lead
- Lead to customer conversion rate
These numbers can help you to set realistic objectives based on previous and projected performance. They can even help you to plan your digital marketing strategies around demonstrated performance so you know you’re targeting audiences who will convert.
Helpful KPIs are those that help you measure your progress toward a defined goal. This could be in a specific marketing channel or across all your efforts. There are tons of different marketing KPIs out there to choose from, so you need to know which one will help you the most.
Choosing the Right KPIs and Marketing Performance Metrics
When it comes to choosing metrics to track, you should be looking for indicators that are meaningful to your business. For example, if your business has reached its capacity of clients, you’d want to look at things like the number of services per client instead of the number of new leads.
It’s important to remember that there are two types of metrics you can use to measure success: KPIs and marketing performance metrics.
KPIs will show how you’re performing against business goals. Things like targeted revenue or new customers. You might look at website traffic to see if your pages are generating enough traffic to create leads or how your quarterly sales are stacking up against your targeted revenue for that period.
Marketing performance metrics are a little different. These measurements support your digital marketing KPIs by showing the success of specific tactics used to achieve your goals. This information is more along the lines of your “traditional” data-driven marketing, measuring specific actions such as organic website traffic or eBook downloads.
Using the right type of performance measurement can give you more specific insights into the area of your business you’re trying to improve. Whether it’s an overall strategy, tracking progress toward your goals, or measuring the success of a single campaign, the right performance metric can inform smart decisions so you get the highest returns on your marketing spend.
Lagging vs Leading Key Performance Indicators
We all know there are lots of different ways to measure success. When it comes to KPIs, there are two types of indicators that can help you evaluate your performance and plan for the future. Although each can be used exclusively, it’s wise to use both so you can create a comprehensive picture of where you are now and determine a path to reach where you’d like to be later.
The first type of KPI benchmark is a leading indicator. These metrics look at future outcomes based on current performance and try to predict where your business will land if it continues on the same trajectory. This might look like a projection of whether you’ll hit your goal for new customer acquisition based on how many new customers you’ve signed per month year-to-date. Leading indicators are often unique to your business and its goals.
The other is a lagging indicator. These metrics are retrospective; they look at past performance and evaluate whether you achieved your goal. One example of a lagging indicator is revenue. You’ve already earned that money; you can’t change the outcome, but you can measure if you hit your target. This information can help you set realistic goals for the next financial period and be prepared to meet your target revenue.
With all these metrics, you have to keep in mind that they’re intended to give you a path for change. Sometimes managers will over-report and track every detail but never make adjustments to change negative results. So when you’re building your data-driven digital marketing strategy, remember to consider both types of metrics and use them as guides until you find the best method for success.

10 Most Important Digital Marketing KPIs
As we mentioned, there are plenty of marketing KPIs to choose from. A few, however, stand out from the crowd as generally beneficial for any business to keep an eye on. Some even have supporting metrics that can give you a more detailed view of the overall performance.
- Website traffic - Increased website traffic is one measurement to ensure that you’re always reaching new prospects, so that in-turn you are able to turn those visitors into leads. Keep in mind that while utilizing SEO and PPC to increase website traffic, you also want to make sure that you are going after the right traffic based on search intent. At Knowmad, we help clients measure this KPI through Google Analytics and HubSpot.
Supporting metrics: organic and paid traffic volumes, new vs. returning visitors and referral visits. - Keyword impressions and ranking - Keyword impressions are a measurement of how many times your website popped up in search results for a given keyword. Your keyword ranking indicates where in the search results your page was shown. Ideally, you want high impressions and a high ranking to encourage the most traffic to your site.
- Social reach and engagement - Like keywords, these two metrics go hand-in-hand. Your social reach can be easily measured by your followers. It’s an indicator of how many people can see your posts. Your engagement goes one step further to see how many people interact with your brand on social media through things like shares, likes and comments. Most brands will have one or two channels where they thrive and a successful digital marketing strategy should take those into consideration.
Supporting metrics: number of subscribers, followers, likes or comments - Email engagement - You might spend lots of time and money on your email marketing campaigns, and monitoring engagement is a great way to determine its worth. Gathering data (like opens and clicks) from your email list can be extremely valuable when it comes to crafting new campaigns. However, keep in mind that recent iOS updates have made it a little more difficult to track this data accurately for iphone users.
Supporting metrics: open and click-through rates - Visitor to lead conversion rate - This metric shows how many website visitors are interacting with your brand (typically through some sort of call-to-action) and becoming leads. It’s important to optimize your conversion strategies to improve the quantity and quality of your leads.
- Cost per lead - When running a PPC campaign, it’s easy to run out of budget without having a clearly defined strategy. One of the most important aspects of a paid search strategy is evaluating your cost per lead (CPL) and ensuring that you are going after the right keywords based on search intent, while staying within your budget. The CPL can often give insight into ROI and verifying that your revenue is staying consistently lower than your targets.
- Lead to customer conversion rate - Measuring this rate will show you how many of your overall leads turn into customers. This KPI is valuable because it helps you find your brand’s ratio of conversion. You can use the metrics to determine how many marketing leads are needed to meet your sales goals for new customer acquisition.
- Cost per customer - This will tell you how much it costs your business to turn 1 website visitor into a customer. It is the total dollar amount spent moving prospects all the way through the marketing funnel until they purchase. Similar to the cost per lead metric, monitoring your cost per customer provides valuable information about your marketing strategies and sales process. Ultimately, this can help you make important business decisions and improve your return on investment (ROI).
- Number of MQLs - Marketing qualified leads (MQL) are those that show enough promise to go to your sales team. These leads prove that you’re attracting the right audience and have considerable opportunities to convert prospects into customers. This number will be less than your normal visitor conversion rate because it takes into account other factors such as where the lead was referred from and what type of demographic they fit into.
Supporting metrics: landing page conversion rates, CTA click-through rates and gated downloads. - Number of SQLs - Sales qualified leads (SQL) are typically the closest to making purchases. These are leads your sales team should be spending the most time and energy on closing. A helpful metric to view is how many MQLs turn into SQLs and how long this typically takes. That can tell you how long you need to move a qualified lead through your sales funnel.
Matching Performance Metrics to Your Marketing and Sales Funnel
As you probably noticed in the list above, the most important metrics to track have to do with leads and conversions. You want to make sure leads are moving through the sales funnel at a somewhat predictable rate and closing at acceptable ratios.
To see how leads move through your sales funnel and to make sure you have enough prospects in each section at any given time, match the metrics you measure with the different portions of your funnel. This can give you a better idea of how many people move from one stage to the next and if you need to increase or improve your marketing efforts in any area.
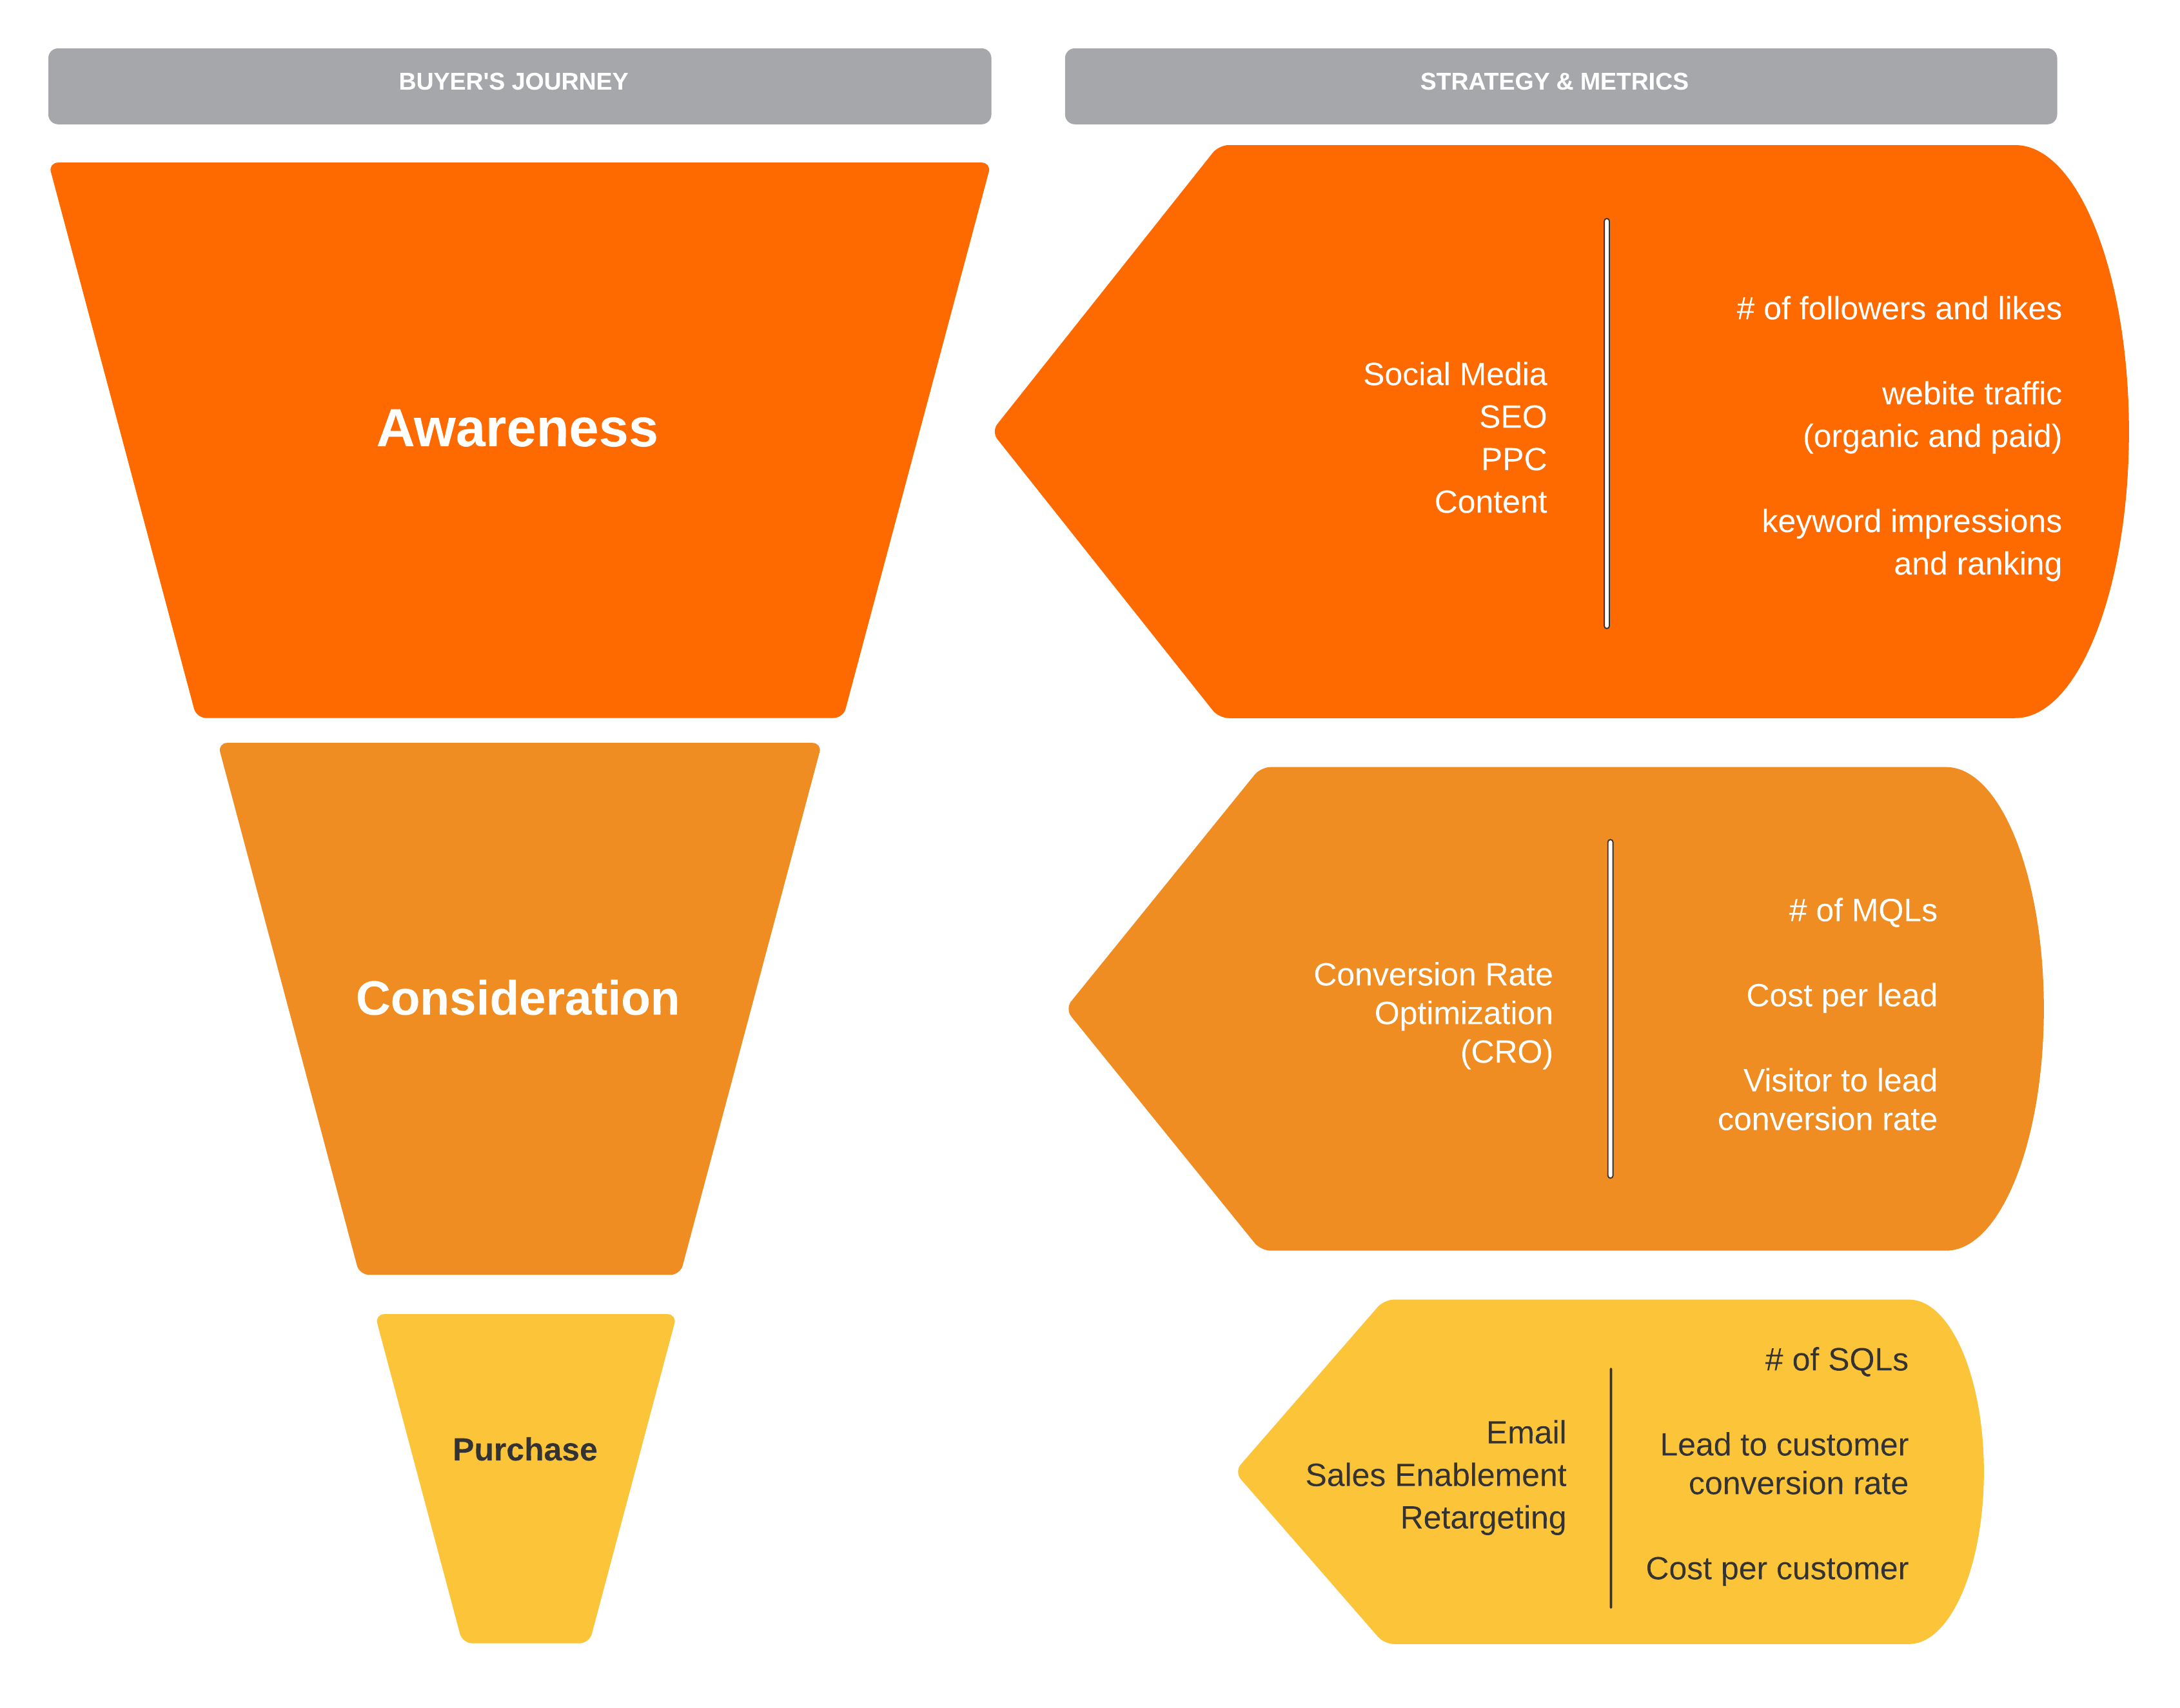
Top of Funnel
This part of your funnel corresponds with the awareness phase in the customer journey. Here, you’re simply trying to increase your business discoverability and encourage or attract new customers. You can do this by utilizing SEO tactics, opting into pay-per-click (PPC) ad campaigns, leveraging your social channels, and/or creating valuable content for readers. Here are some KPIs that are used to evaluate the success of your marketing efforts towards buyers in this stage of their buyer’s journey:
-
- Website traffic
- Keyword impressions and ranking
- Social reach and engagement
Middle of Funnel
Once leads move into the middle of the funnel, your job is to engage and nurture them. You want to find ways to encourage them to further action on your page and give them the information they need to make a buying decision. Things like optimizing landing pages for conversions, capturing leads through forms, and including clear CTAs on your web pages are a few ways to accomplish this. Helpful KPIs for this audience include:
-
- Number of MQLs
- Cost per lead
- Visitor to lead conversion rate
- Email engagement
Bottom of Funnel
Leads that make it all the way to the bottom of your funnel are prime candidates to become customers. These should be SQLs that are ready to convert because they’ve made it to the final stages of the customer journey.
If you’re pushing a good number of people into the bottom of your funnel, but not converting enough of them, then this is a point where managers should reevaluate their strategy. You can monitor data from different KPIs to do this, including:
-
- Number of SQLs
- Lead to customer conversion rate
- Cost per customer
Improving Digital Marketing Strategy By Performance Benchmarking and Evaluating KPIs
Key performance indicators are more than just reports to share with business leaders and executives. Marketing managers should also be privy to the data KPIs provide so they can analyze and adjust strategies to reach company goals. Let’s look at one example of how utilizing KPIs can help a marketing leader.
Sample KPI for Marketing Manager
Taking an overview of their company’s marketing efforts, a manager might find:
-
- 2,500 monthly organic website visitors
- 20 qualified leads from website conversions
- 5 customers
With this picture, the manager can see that the website is converting one customer per 500 visitors. That number can then help them decide if this is a worthwhile return on their investment or if they need to consider other tactics to improve the conversion rate. It’s important for managers to have access to all the company’s KPIs because looking at all three of these together gives them a more complete picture of performance than viewing them individually.
Now a manager can reassess their strategy to boost performance or continue using these tactics across other channels if that was their desired conversion rate.
Reporting Tools and Monitoring KPIs
Metrics don’t come from thin air, so to create valuable marketing KPIs, you also need effective reporting. Successful reporting starts with choosing the right tool and developing a winning approach. After you’ve devised your marketing strategy, focus on these three action items:
- Get relevant KPIs to the right people on a consistent schedule. For example, send web traffic, MQLs and lead to customer conversions to your marketing manager once a month.
- Present the information so it’s easy to understand and act on. Sending over a spreadsheet full of numbers might not be as helpful as you think. Break down some of the findings and propose actions a manager can take to resolve problems.
- Go beyond traditional spreadsheets or PDFs. Data is more fun when you can play with it, so look to interactive dashboards and visualizations to inform your team. This gives your users the power to review the information and explore new connections someone else might have overlooked.
We recommend using HubSpot for reporting and tracking metrics. It easily integrates with your website, social media and sales pipelines to seamlessly gather and report data. It also offers interactive dashboards so you and your sales team can easily access and analyze information at any time.
Measure Your Marketing Success
Marketing KPIs are an important part of measuring your success. They can help you see how you’re performing and how you can improve your tactics to reach business and sales goals.
Knowmad knows the power of data when building a digital marketing strategy and uses the marketing KPIs and performance metrics to build top-notch channel strategies for our digital marketing services that help your team meet your business and sales objectives. Reach out to us for a consultation to see how we can help you succeed!


